Our current ability to predict the flow of fluids through porous media, for example, in ground water movements, the recovery of oil or the design of filter beds originates from the experimental work performed by French engineer Henry Darcy (1856).
At the time, Darcy was concerned with developing the water works for the town of Dijon, and he needed information which would enable him to determine the size of the filter bed that should be installed to handle the daily throughput of water in the system. To provide this information, he performed a series of experiments in which water was passed downwards through vertical columns of sand at a controlled rate, and fluid pressures were measured at the top and bottom of the columns using mercury manometers. The results showed that there was a linear relationship between the flow rate per unit of cross-sectional area of the column, the column height, and the pressure differential when expressed as the differences in heights of equivalent water manometers above and below the sand. Historically (before the introduction of the SI system of units), the relationship was expressed in the form:

where
 is the volumetric flow rate, A is the cross-sectional, area 1 is the thickness of the sand, and (h1 - h2) is the water equivalent difference in manometer levels. The constant in this equation was found to be dependent upon the sizes of sand particles used in the experiment.
Other workers have subsequently shown that by introducing the concept of fluid potential and the physical properties of fluid, Darcy's original result can be extended to provide a relationship which is universally-applicable to any single-phase fluid, and for any flow direction. Expressed in SI nomenclature, it becomes:

where η is the fluid viscosity; ρ is the fluid density; dФ/dl is the potential gradient; and K is a property of the porous medium having the dimensions of (length)2 and known as permeability. This relationship has appropriately become known as Darcy's Law.
At die Darcy Centennial Hydrology Symposium in 1956, M. King Hubbert presented a paper in which he showed that Darcy's law has a theoretical foundation, and that the law can be derived from the Navier Stokes equation for a viscous fluid. He noted that Darcy's law has many analogies to Ohm's Law for the Conduction of Electricity and Fourier's expression for the conduction of heat. He pointed out, however, mat whilst the relationship given in Eq. (2) may appear to have similarities with the Poiseuille equation for laminar flow of fluids in straight cylindrical capillaries, expressed as:

(where r is the tube radius), the fluid mechanics of flow through porous media are very different from those of flow through capillary tubes. (See Fourier's Law.)
In porous media, inertia forces play an important role since each fluid particle moves through a tortuous path in which it is continuously being accelerated and decelerated; whereas in capillary flow, the fluid particles move in straight lines at a constant velocity. Thus, the similarities between Darcy's law and Poiseuille's equation are fortuitous. (See Poiseuille Flow.)
Darcy's law strictly applies to the flow of a single-phase fluid, in which case permeability is a property of the rock and is independent of the fluid flowing through the pores. When two or more phases flow through the rock at the same time however, each phase must flow through part of the total cross-section of pore space, thus reducing the flow area available to the other phases. As a result, the effective permeability of the individual phases is reduced. To accommodate this situation, Darcy's law has been modified by introducing a multiplication factor, known as relative permeability, ki, for each phase.

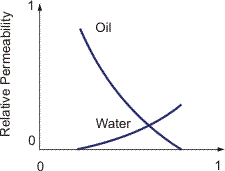
The value of ki will clearly depend upon the fraction of the pore flow area occupied by the other phases, and hence upon the saturation of the other phases. Typical relative permeability curves for two-phase oil and water flow through a sandstone rock are shown in Figure 1.
The relative permeability of one phase decreases as the saturation of the other phase increases, and vice versa. Note that the relative permeability of each phase becomes zero at a nonzero value of the phase saturation. This is because of the fluid pore structure, which prevents phase saturations below a certain level. Thus for two-phase flow, individual phase permeabilities depend on the nature of the other fluids as well as the structure of the rock matrix.
REFERENCES
Darcy, H. (1856) Les Fontaines Publiques de la Ville de Dijon., Victor Dalmont, Paris.
King, Hubbert M. (1956) Darcy's Law and the Field Equations of the Flow of Underground Fluids., Trans. AIME, 207: 222-239.
References
- Darcy, H. (1856) Les Fontaines Publiques de la Ville de Dijon., Victor Dalmont, Paris.
- King, Hubbert M. (1956) Darcy's Law and the Field Equations of the Flow of Underground Fluids., Trans. AIME, 207: 222-239.
